
| NeuroAids Vol. 2, Issue 7 (August 1999) |
Imaging of Neuroaids K. E. Sakaie1 and R. G. Gonzalez1
|
| Abstract |
|---|
| Abstract | CT & MRI | MRS | fMRI | SPECT | Secondary Complications | References |
| Up to 90% of those infected by the human immunodeficiency virus will have central nervous system (CNS) involvement (1). This may include a subclinical CNS HIV infection, subtle motor cognitive deficits, or a progressive, severe dementia. The patient who is immunocompromised by the virus may also have CNS infestation by parasites, fungi, uncommon bacteria, other viruses, and neoplasms uncommon in the immunocompetent population. CNS injury by HIV and its complications produce neuropathological, physiologic, and metabolic abnormalities that are detectable noninvasively by modern neuroimaging methods. Modern structural imaging involving CT and MRI plays a critical role in the clinical evaluation and treatment of HIV+ patients with new onset neurological symptoms. The advanced functional and metabolic imaging probes - Magnetic Resonance Spectroscopy (MRS), dynamic contrast functional MRI (fMRI), and Single Photon Emission Computed Tomography (SPECT) - may contribute diagnostic specificity to structural findings and are providing insight into the pathobiology of HIV related dementia. For discussion of Positron Emission Tomography (PET), another advanced probe, the reader is referred to the literature (2). Here we review the effects of HIV on the adult brain as revealed by clinical and advanced neuroimaging. |
| Computed Tomography & Magnetic Resonance Imaging |
|---|
| Abstract | CT & MRI | MRS | fMRI | SPECT | Secondary Complications | References |
|
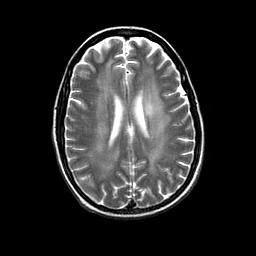
Structural neuroimaging with magnetic resonance imaging (MRI)
and computed tomography (CT) of HIV encephalopathy is usually normal
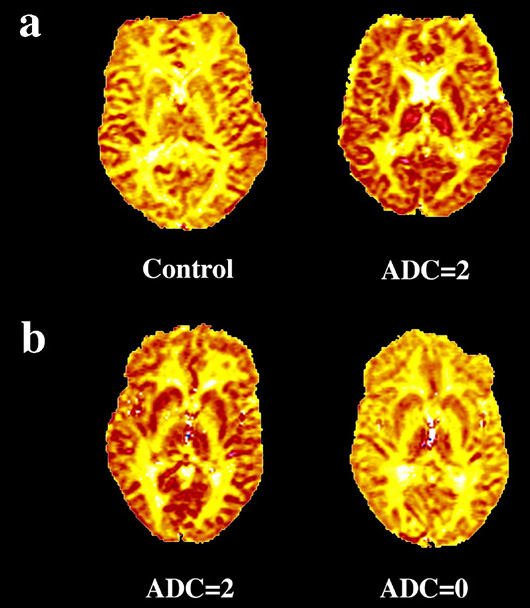
until later stages of the disease. HIV infection of the CNS produces a progressive cognitive-motor
disorder often called the AIDS Dementia Complex (ADC). Damage to neural
tissues occurs mainly in the subcortical gray matter, especially the
basal ganglia, which is thought to produce a progressive subcortical
dementia that may be detected in early stages by neuropsychological
testing. Mononuclear cell infiltrates, multinucleated giant cells,
reactive astrocytosis, abnormalities of the white matter and vacuolar
changes in the infected tissues are observed histopathologically.
In the early stages of CNS HIV infection, MR and CT imaging studies
do not usually demonstrate brain abnormalities.
|
| Magnetic Resonance Spectroscopy |
|---|
|
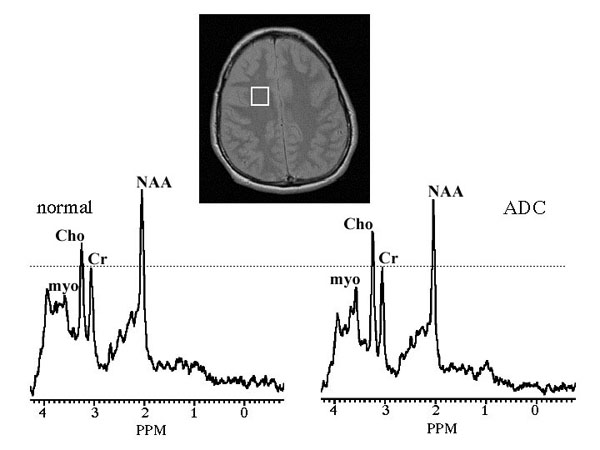
Magnetic resonance spectroscopy (MRS) demonstrates neurochemical abnormalities early in the course of CNS HIV infection.
Long one of the essential assays in analytic chemistry, MRS is emerging as a powerful tool for noninvasive study of in vivo pathology. MRS can be performed with a clinical MRI scanner, yielding quantitative measurements of metabolite concentrations in 5 to 10 minutes. Such measurements provide biochemical information not available from analyses of blood, urine, and cerebrospinal fluid. MRS also augments structural measurements (MRI, CT) and neuropsychological tests. In MRS, one detects a signal resulting from the interaction between atomic nuclei and the local magnetic field. The focus here is on signals from protons in hydrogen, although a number of other nuclei, notably in carbon and phosphorus, are studied in vivo. Each type of molecule has different magnetic properties, allowing one to distinguish signals from protons within different types of molecules. For example, figure 2 depicts brain spectra with distinct peaks from neurochemicals commonly studied by MRS: myoinositol (myo), choline (Cho), creatine (Cr), and N-acetyl aspartate (NAA). The intensity of each peak indicates the concentration of the molecule. The spectra show quantitative differences between HIV-positive and HIV-negative subjects. Other molecules of interest include lactate (LAC), glutamate (GLU), glutamine (GLN), and lipids. The figure also shows that MRS can localize the signal, allowing comparison of metabolite changes among different tissue types. ADC patients display significant differences in metabolite changes among deep gray, white, and cortical gray matter.
The Cho peak comprises signal from several compounds: phosphocholine, glycerophosphocholine, and, to a lesser degree, free choline. As astrocytes contain more Cho than neurons, astrogliosis can increase the levels of Cho with respect to NAA. Pathologic disturbances in cell membrane turnover may also lead to an elevation of Cho levels. Elevated Cho is found throughout the brain in advanced ADC (7)(8)(10)-- possibly reflecting astrogliosis found histologically. Trends in metabolite levels measured with MRS correlate with and can exceed the sensitivity of other indicators (15). Changes in the NAA signal indicate neuronal injury even when MRI, CT, and psychological exams appear normal (16)(17). Cross sectional (Figure 3) (18) and longitudinal (Figure 4) (5) studies of HIV+ patients with cognitive abnormalities find progressive decreases in NAA and increases in Cho and myo as dementia worsens.
The drop in NAA also correlates with CD4 counts (Figure 5) (18) and the degree of encephalopathy (18)(19). Elevation in myo and Cho occurs earlier and to a greater extent in the basal ganglia and white matter than in the cortex (Figure 3), a result that agrees with the clinical finding that ADC is a subcortical dementia. Furthermore, myo and Cho elevation is found in HIV positive patients before the onset of ADC (9). Treatment with zidovudine reverses the trends among the metabolites, indicating that the cellular injury and gliosis is, to a certain extent, reversible (17)(20). MRS may therefore provide means for early diagnosis and evaluation of treatment.
|
| Functional MRI |
|---|
|
Dynamic contrast functional MRI demonstrates abnormally increased
cerebral blood volume in gray matter and multifocal cortical cerebral
blood flow deficiencies.
Chang and her colleagues have recently reported a CBF analysis using dynamic contrast fMRI (22). They found that HIV+ subjects had areas of decreased CBF in the inferolateral frontal cortices and increased CBF in the posterior inferior white matter (22). The authors concluded that these findings were similar to those described by investigators employing SPECT. |
| Single Photon Emission Computed Tomography |
|---|
|
Perfusion deficits are observed in HIV encephalopathy with single photon emission computed tomography (SPECT).
SPECT measures brain perfusion using radiopharmeceuticals such as HMPAO Tc-99m-hexamethylpropyleneamine oxine (HMPAO) and Iodine-123-N-isopropyl-p-iodoamphetamine-hydroacetate (IMP). Imaging of gamma rays from radioactive decay can localize perfusion defects. Such defects can appear even when structural CT and MRI scans appear normal and hence provide early clues about ADC. SPECT also improves the accuracy of diagnosis, as differences in uptake patterns among radiopharmeceuticals can vary with the severity of AIDS encephalopathy (23). |
| Secondary Complications |
|---|
|
Unusual brain infections in the immunocompromised HIV patient
are commonly observed with MRI and CT
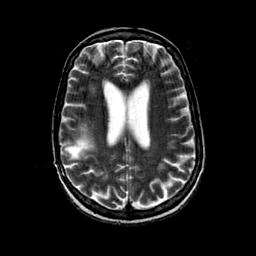
Progressive multifocal leukoencephalopathy (PML), caused by JC virus infection of oligodendrocytes, leads to demyelination. Once the diagnosis is made, the prognosis is ominous, with death usually occuring within 9 months to 1 year. The incidence of PML in the AIDS population has been estimated to be 1-4%. MR is the modality of choice for the evaluation of this entity. Characteristic MR findings include areas of decreased T1 and increased T2 signal affecting white matter, usually in asymmetric distribution, but with predilection for the parietal and occipital lobes (Figure 8). The white matter lesion often extends to the subcortical U fibers with characteristic scalloped margins. There is no associated mass effect; indeed, there is often evidence of tissue loss. Contrast enhancement is uncommon. On CT, areas of abnormal decreased white matter density without mass effect or enhancement may be seen. Cerebellum, brainstem, basal ganglia, thalamus, and external capsule involvement by PML, although infrequent, can be seen.
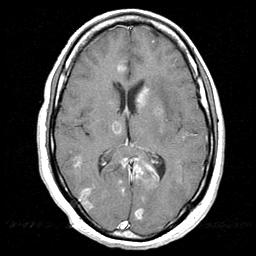
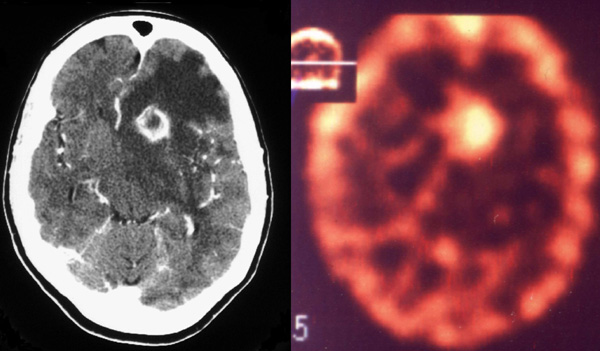
Primary central nervous system lymphoma often resembles brain infections on structural imaging The most common malignant neoplasms associated with AIDS are (1) primary CNS lymphoma, which occurs in up to 6% of the neurological symptomatic AIDS patients, (2) metastatic lymphoma, which may result in leptomeningeal and epidural spread, and (3) Kaposi sarcoma, which rarely affects the CNS. In AIDS patients, primary CNS lymphoma is the second most common cause of a focal CNS mass lesion after toxoplasma encephalitis. Clinically, it is difficult to accurately differentiate between primary brain lymphoma and other intracranial masses, particularly toxoplasma encephalitis. On CT and MR, lymphoma may appear as focal ring and/or nodular enhancing mass lesion(s) with surrounding edema (Figure 9). The lesions may be single or multiple, superficial (cortico-medullary junction) and/or deep (basal ganglia, thalamus, corpus callosum). The posterior fossa may also be involved (cerebellum, pons, midbrain). Rapid progression of the mass(es) on serial imaging studies also favor lymphoma. However, CT and MR findings are usually not pathognomonic, and lymphoma cannot be differentiated with certainty from toxoplasma encephalitis or other infectious process. In AIDS patients, primary CNS lymphoma resembles toxoplasmosis in 50-80% of the cases.
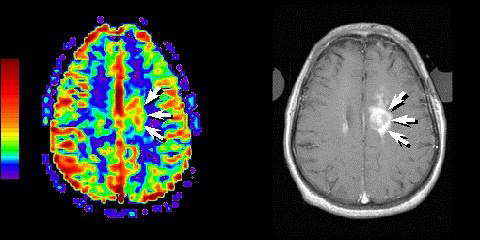
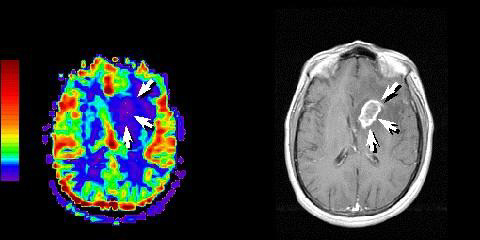
Functional MRI and SPECT may aid in differentiating lymphoma from toxoplasmosis Employing dynamic contrast fMRI, Ernst and colleagues found increased rCBV in regions with active lymphoma (Figure 10) but reduced rCBV in the central regions of toxoplasmosis lesions (Figure 11). rCBV is reduced in the edema surrounding lesions of both types (30). The rise within active lymphoma probably results from hypervascularity within the tumor, and the drop within toxoplasmosis lesions probably reflects lack of vasculature. The drop within the edema probably reflects vasoconstriction with increased interstitial pressure.
Different uptake patterns of radiopharmeceuticals as detected by SPECT may help differentiate pathologies. For example, Tl-201 can accurately distinguish primary cerebral lymphoma from infection processes, particularly cerebral toxoplasma encephalitis (31)(32)(33)(34). Uptake is due to an active cell membrane pump in the active, growing neoplastic tissue. Active lymphoma is considered when the intracranial Tl-201 SPECT activity is greater than the activity of the contralateral scalp (Figure 12). Non-lymphoma lesions do not display increased activity.
|
| Acknowledgements |
|---|
|
The authors thank P.L. Lee (MGH) for providing figure 3, L. Chang (UCLA) for use of figures 4 and 6, H.E. Gendelman (U. Nebraska) and Arnold Publishers for figure 5, T. Ernst (UCLA) for figures 10 and 11, and A. Ruiz and J. Donovan-Post (U. Miami) for providing figure 12. |
| Symbol Definition |
|---|
|
T2, T2*, and T1 are parameters which influence the size of the MRI signal. The values of these parameters, which depend on the rate and intensity of fluctuations in magnetic fields at the atomic level, often differ among tissue types. For example, lipids have a shorter T2 than cerebrospinal fluid. MRI takes advantage of these differences to enhance the image contrast among tissues. |
|
(1) Chiang FL, Walot I, Sinow RM, Mehringer CM (1998). Diagnostic imaging of the brain in acquired immunodeficiency syndrome (AIDS). Semin Ultrasound CT MR 19(2):133-53. Medline (2) Navia BA, Gonzalez RG (1997). Functional imaging of the AIDS dementia complex and the metabolic pathology of the HIV-1-infected brain. Neuroimaging Clin N Am 7(3):431-45. Medline (3) Trotot PM, Gray F (1997). Diagnostic imaging contribution in the early stages of HIV infection of the brain. Neuroimaging Clin N Am 7(2):243-60. Medline (4) Smirniotopoulos JG, Koeller KK, Nelson AM, Murphy FM (1997). Neuroimaging--autopsy correlations in AIDS. Neuroimaging Clin N Am 7(3):615-37. Medline (5) Gonzalez RG, Ruiz A, Tracey I, McConnel J (1998). The Neurology of AIDS (Eds. H. E. Gendelman, S. A. Lipton, L. Epstein, S. Swindells), Edwin Arnold Publishers, London, pp. 333-352. (6) Urenjak J, Williams SR, Gadian DG, Noble M (1993). Proton nuclear magnetic resonance spectroscopy unambiguously identifies different neural cell types. J Neurosci 13(3):981-9. Medline (7) Chong WK, Sweeney B, Wilkinson ID, Paley M, Hall-Craggs MA, Kendall BE, Shepard JK, Beecham M, Miller RF, Weller IV, et al (1993). Proton spectroscopy of the brain in HIV infection: correlation with clinical, immunologic, and MR imaging findings. Radiology 188(1):119-24. Medline (8) Meyerhoff DJ, MacKay S, Bachman L, Poole N, Dillon WP, Weiner MW, Fein G (1993). Reduced brain N-acetylaspartate suggests neuronal loss in cognitively impaired human immunodeficiency virus-seropositive individuals: in vivo 1H magnetic resonance spectroscopic imaging. Neurology 43(3 Pt 1):509-15 Medline (9) Tracey I, Carr CA, Guimaraes AR, Worth
JL, Navia BA, Gonzalez RG (1996). Brain choline-containing compounds
are elevated in HIV-positive patients before the onset of AIDS dementia
complex: A proton magnetic resonance spectroscopic study. Neurology
46(3):783-8. Medline (10) Menon DK, Ainsworth JG, Cox IJ, Coker RC, Sargentoni J, Coutts GA, Baudouin CJ, Kocsis AE, Harris JR (1992). Proton MR spectroscopy of the brain in AIDS dementia complex. J Comput Assist Tomogr 16(4):538-42 Medline (11) McConnell JR, Swindells S, Ong CS, Gmeiner WH, Chu WK, Brown DK, Gendelman HE (1994). Prospective utility of cerebral proton magnetic resonance spectroscopy in monitoring HIV infection and its associated neurological impairment. AIDS Res Hum Retroviruses 10(8):977-82. Medline (12) Barker PB, Lee RR, McArthur JC (1995). AIDS dementia complex: evaluation with proton MR spectroscopic imaging. Radiology 195(1):58-64. Medline (13) Ketzler S, Weis S, Haug H, Budka H (1990). Loss of neurons in the frontal cortex in AIDS brains. Acta Neuropathol 80(1):92-4 Medline (14) Masliah E, Ge N, Morey M, DeTeresa R, Terry RD, Wiley CA (1992). Cortical dendritic pathology in human immunodeficiency virus encephalitis. Lab Invest 66(3):285-91 Medline (15) Lopez-Villegas D, Lenkinski RE, Frank I (1997). Biochemical changes in the frontal lobe of HIV-infected individuals detected by magnetic resonance spectroscopy. Proc Natl Acad Sci U S A 94(18):9854-9. Medline (16) Alonso J, Rovira A, Capellades J, Ocana I, Rio J, Wicklow K, Sauter R, Gili J (1996). [Cerebral proton spectroscopy of people infected with the human immunodeficiency virus]. [Article in Spanish]. Med Clin (Barc) 107(10):361-5. Medline (17) Vion-Dury J, Nicoli F, Salvan AM, Confort-Gouny S, Dhiver C, Cozzone PJ (1995). Reversal of brain metabolic alterations with zidovudine detected by proton localised magnetic resonance spectroscopy. Lancet 345(8941):60-1. Medline (18) Chang L, Ernst T, Leonido-Yee M, Walot I, Singer E (1999). Cerebral metabolite abnormalities correlate with clinical severity of HIV-1 cognitive motor complex. Neurology 52(1):100-8. Medline (19) Harrison MJ, Newman SP, Hall-Craggs MA, Fowler CJ, Miller R, Kendall BE, Paley M, Wilkinson I, Sweeney B, Lunn S, Carter S, Williams I (1998). Evidence of CNS impairment in HIV infection: clinical, neuropsychological, EEG, and MRI/MRS study. J Neurol Neurosurg Psychiatry 65(3):301-7. Medline (20) Wilkinson ID, Lunn S, Miszkiel KA, Miller RF, Paley MN, Williams I, Chinn RJ, Hall-Craggs MA, Newman SP, Kendall BE, Harrison MJ (1997). Proton MRS and quantitative MRI assessment of the short term neurological response to antiretroviral therapy in AIDS. J Neurol Neurosurg Psychiatry 63(4):477-82. Medline (21) Tracey I, Hamberg LM, Guimaraes AR, Hunter G, Chang I, Navia BA, Gonzalez RG (1998). Increased cerebral blood volume in HIV-positive patients detected by functional MRI. Neurology 50(6):1821-6 Medline (22) Chang L, Speck O, Leonido-Yee M, Ernst T (1999). Cerebral perfusion abnormalities in patients with HIV, 51st Meeting of the American Academy of Neurology, Toronto. (23) Pohl P, Vogl G, Fill H, Rossler H, Zangerle R, Gerstenbrand F (1988). Single photon emission computed tomography in AIDS dementia complex. J Nucl Med 29(8):1382-6 Medline (24) Cohen WA (1997). Intracranial bacterial infections in patients with AIDS. Neuroimaging Clin N Am (2):223-9. Medline (25) Ramsey RG, Gean AD (1997). Neuroimaging of AIDS. I. Central nervous system toxoplasmosis. Neuroimaging Clin N Am (2):171-86. Medline (26) Lizerbram EK, Hesselink JR (1997). Neuroimaging of AIDS. I. Viral infections. Neuroimaging Clin N Am 7(2):261-80. Medline (27) Harris DE, Enterline DS, Tien RD (1997). Neurosyphilis in patients with AIDS. Neuroimaging Clin N Am 7(2):215-21. Medline (28) Whiteman ML (1997). Neuroimaging of central nervous system tuberculosis in HIV-infected patients. Neuroimaging Clin N Am 7(2):199-214. Medline (29) Harris DE, Enterline DS (1997). Neuroimaging of AIDS. I. Fungal infections of the central nervous system. Neuroimaging Clin N Am (2):187-98. Medline (30) Ernst TM, Chang L, Witt MD, Aronow HA, Cornford ME, Walot I, Goldberg MA (1998). Cerebral toxoplasmosis and lymphoma in AIDS: perfusion MR imaging experience in 13 patients. Radiology 208(3):663-9 Medline (31) Ruiz A, Ganz WI, Post MJ, Camp A, Landy H, Mallin W, Sfakianakis GN (1994). Use of thallium-201 brain SPECT to differentiate cerebral lymphoma from toxoplasma encephalitis in AIDS patients. AJNR Am J Neuroradiol 15(10):1885-94. Medline (32) O'Malley JP, Ziessman HA, Kumar PN, Harkness BA, Tall JG, Pierce PF (1994). Diagnosis of intracranial lymphoma in patients with AIDS: value of 201TI single-photon emission computed tomography. AJR Am J Roentgenol 163(2):417-21 Medline (33) Lorberboym M, Wallach F, Estok L, Mosesson RE, Sacher M, Kim CK, Machac J (1998). Thallium-201 retention in focal intracranial lesions for differential diagnosis of primary lymphoma and nonmalignant lesions in AIDS patients. J Nucl Med 39(8):1366-9. Medline (34) Palestro CJ, Torres MA (1999). Radionuclide imaging of nonosseous infection. Q J Nucl Med 1999 Mar;43(1):46-60. Medline |
| Top |
|
NeuroAids is a project of Science OnLine funded through a grant from the National Institute of Mental Health. |
|

|
Copyright ©1998 by AAAS Science Publications, Inc. |
